I keep track of my movie watching on MovieLens, a free service of the University of Minnesota. I've rated about 1000 movies. The site lets you look at your own rating data a few ways, but it also lets you download all* of it. So, I downloaded by data and wrote some R bits to make the following plots.
'*' Not actually all of it. There are two relevant files you can download. One has your ratings and the date when you made that rating, but it only goes back to 2015. Another has all of the movies you've rated, and your rating, but it does not include the date when you rated the movie.
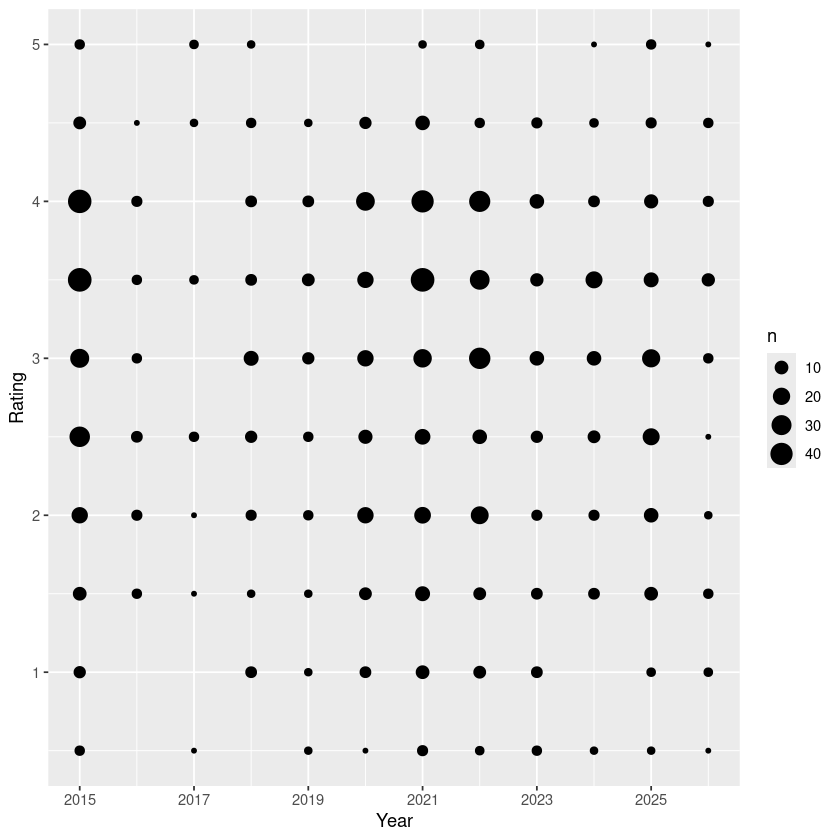
The first plot shows the number of each rating (0.5,1,1.5,...,5) versus the year I rated the movie. 2026 isn't over yet, of course.
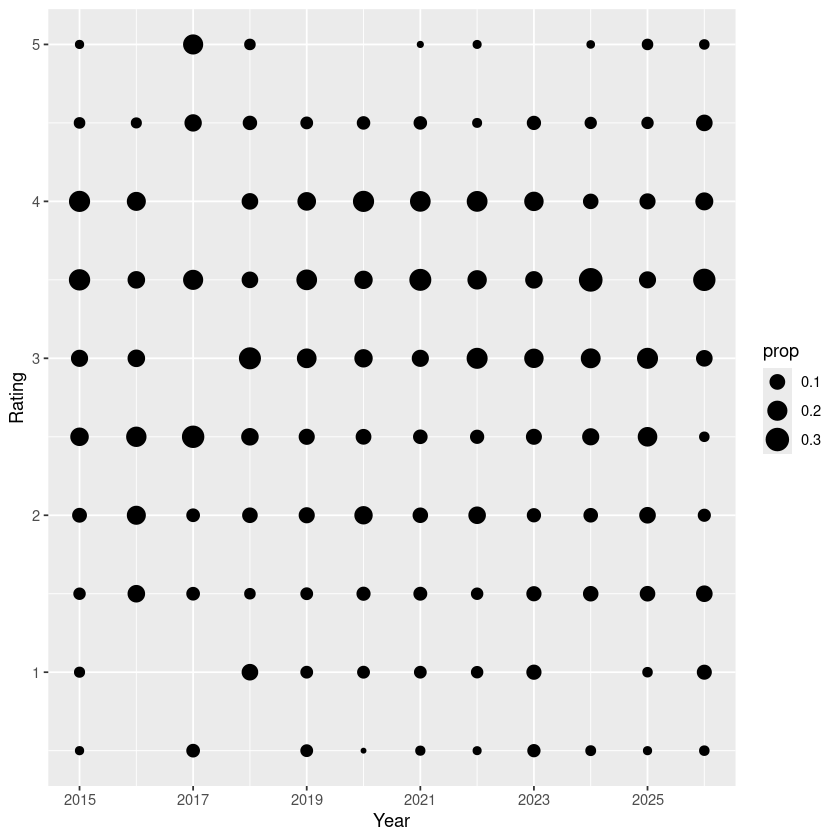
This one shows the same data, but proportionally: the percent of each rating in each year. This is the one I was initially interested in, to see if I'm getting more or less "harsh". Ultimately, not that interesting.
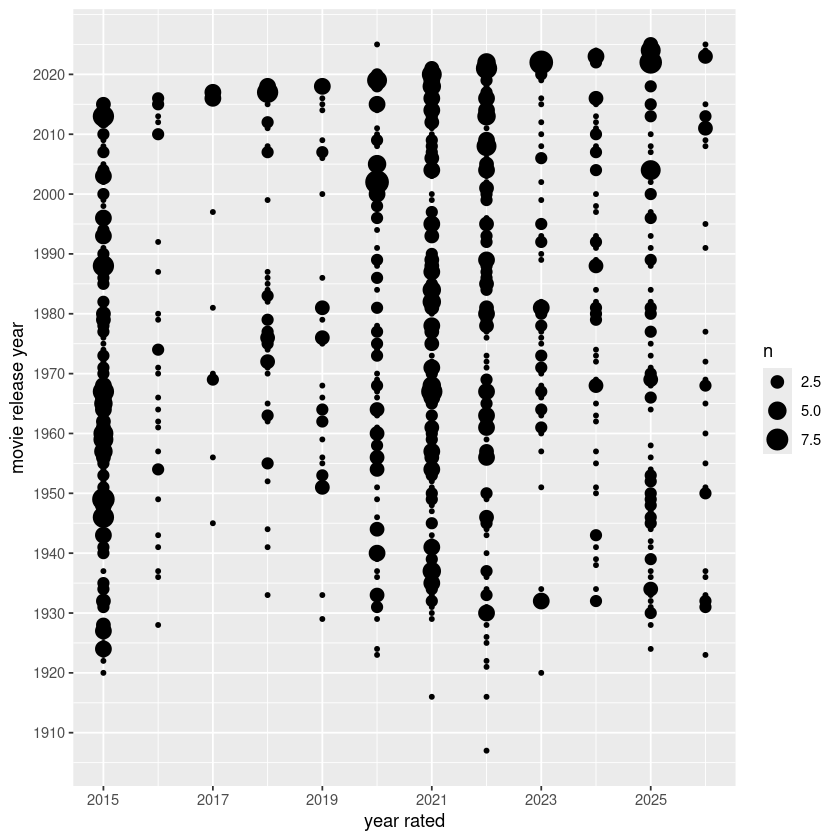
This one shows the year of release versus the year of rating.
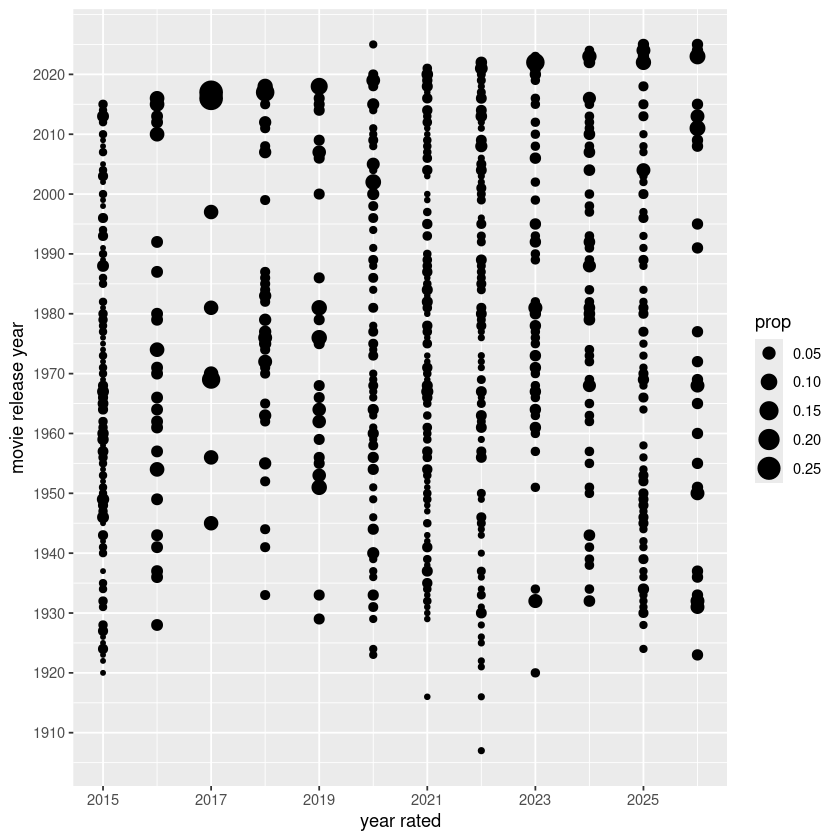
This is again the year of release versus the year of rating, normalized by year.
This one shows number of ratings verses release year. (Click to embiggen.)
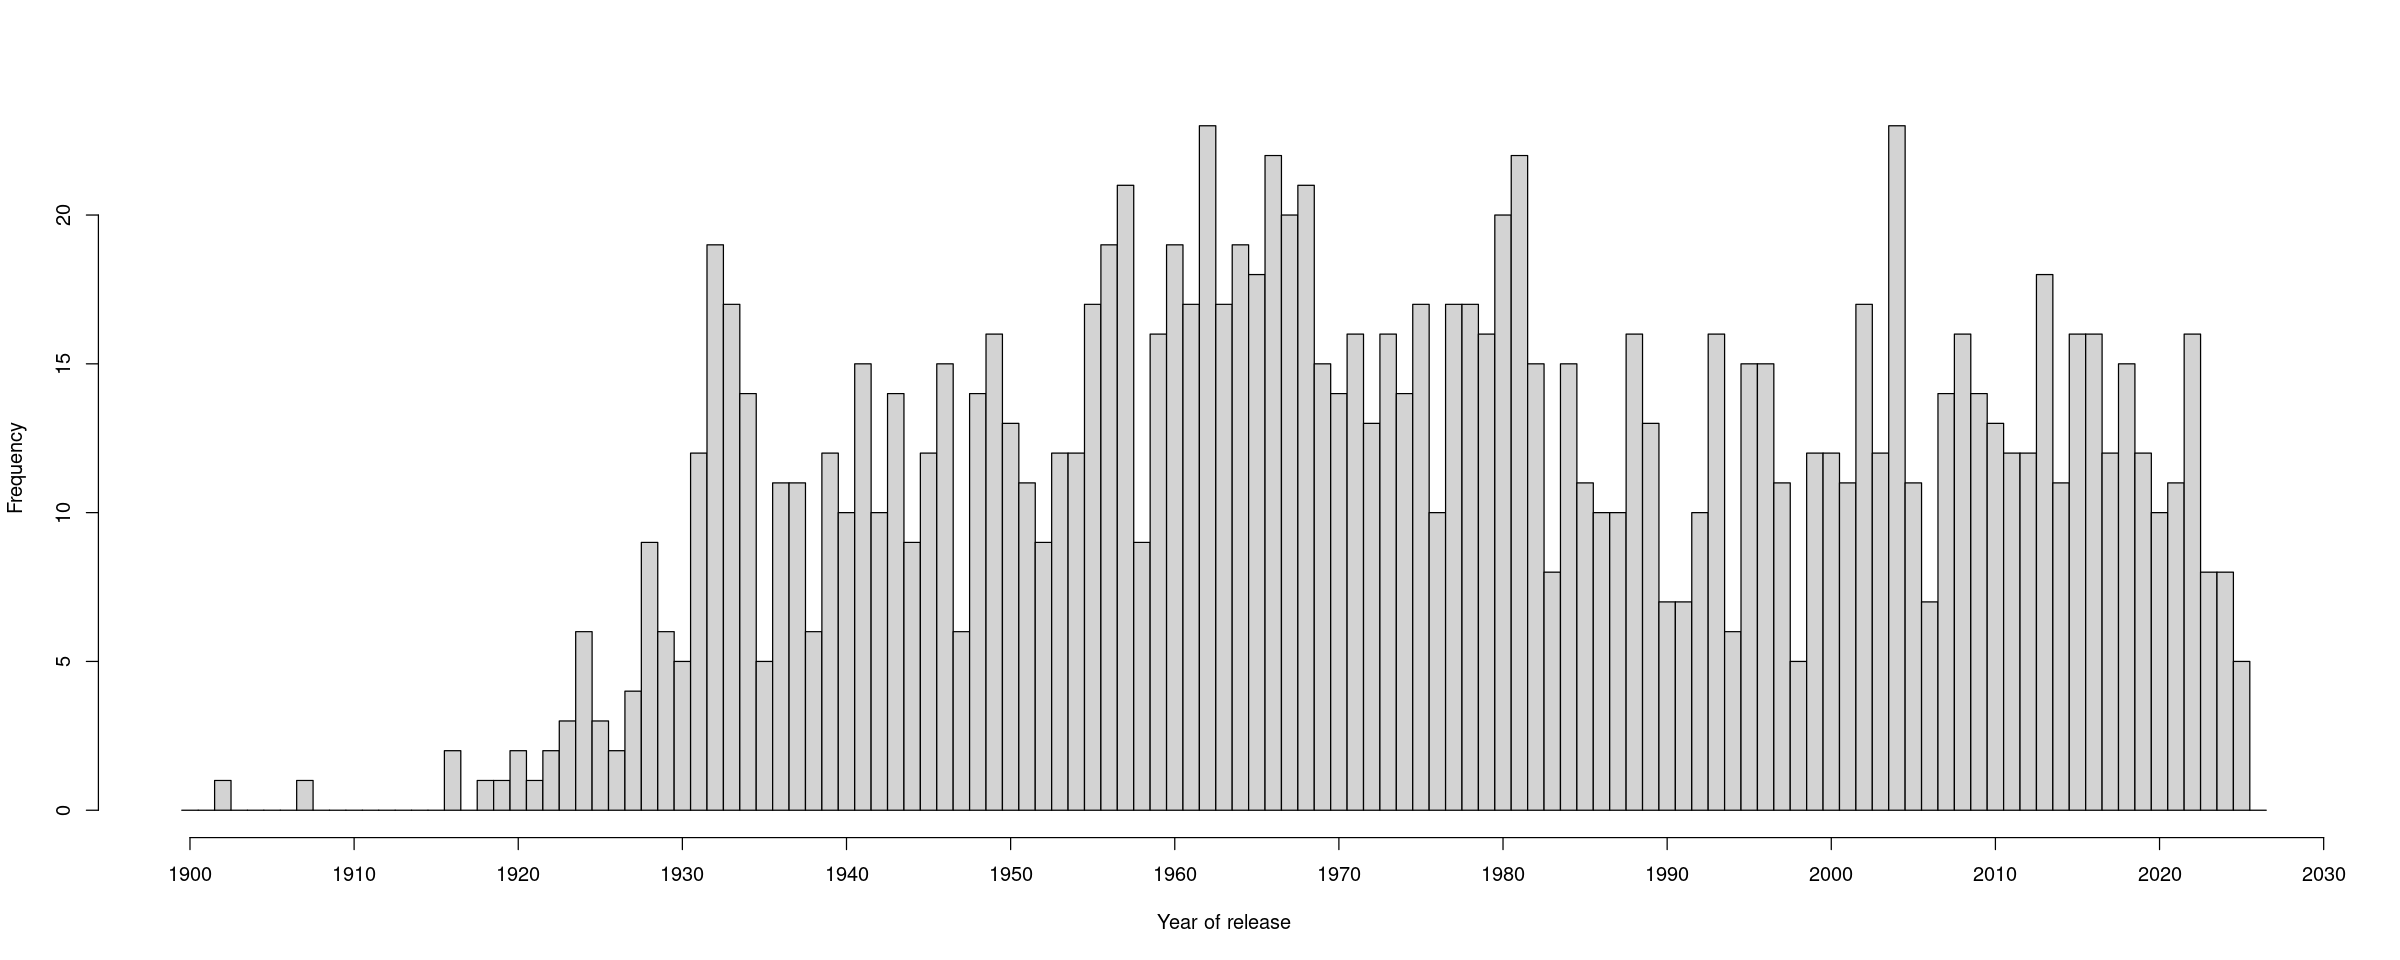
The years with the most ratings are 2004 (23), 1962 (23), 1981 (22), 1966 (22), 1968 (21), 1957 (21), 1980 (20), 1967 (20).
and the years after 1929 with the fewest ratings starts 1930 (5),1935 (5), 1998 (5), 2025 (5), 1938 (6), 1947 (6), 1994 (6), 1990 (7), 1991 (7), 1983 (8).
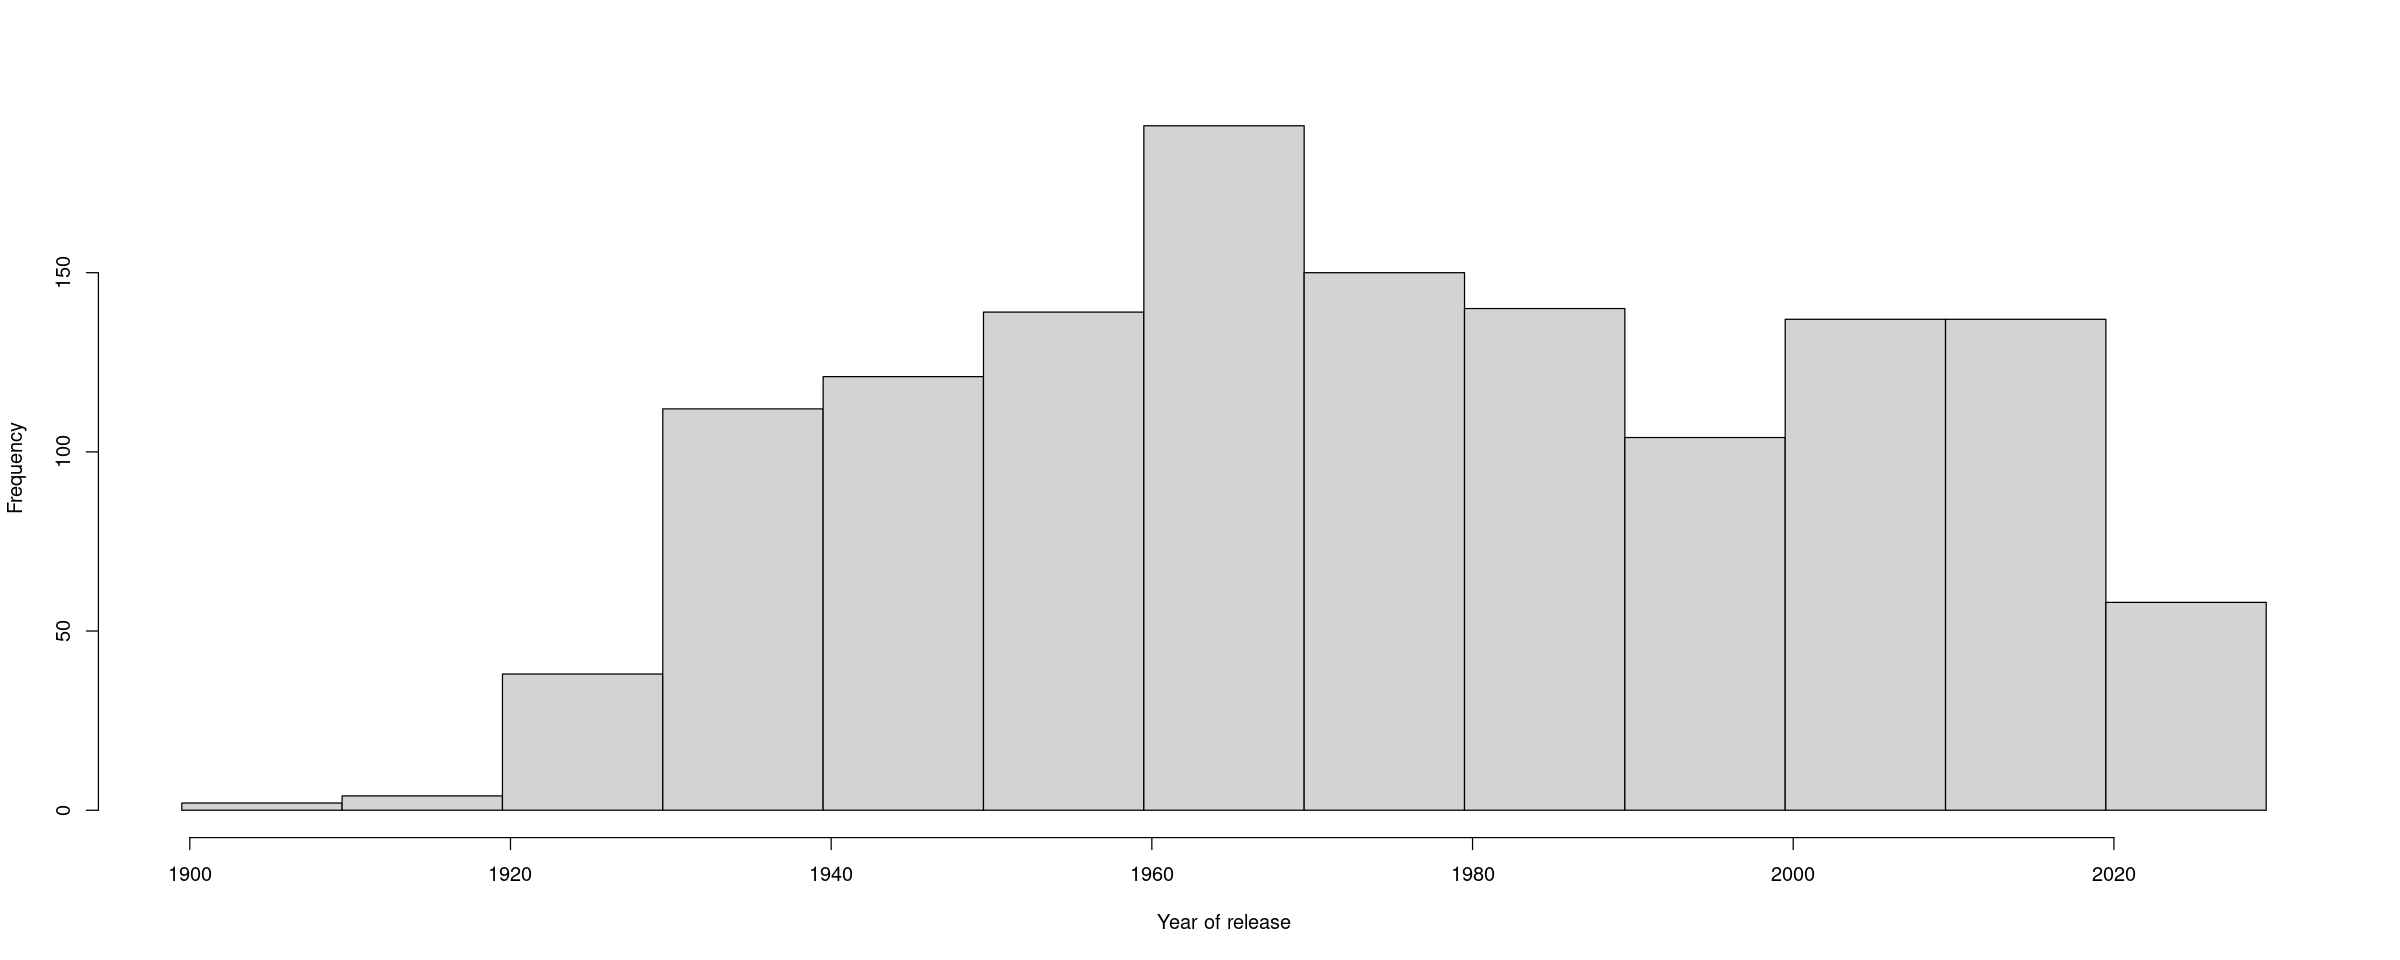
This one shows number of ratings versus release year again, grouped by decades. (Click to embiggen.)
Now, here's the mean rating by year of release:

Years with highest mean ratings are 1927 (4.25), 1983 (3.81), 1938 (3.75), 1929 (3.67), 1985 (3.59), 1940 (3.55), 1957(3.55).
Years with the lowest mean ratings are 1925 (2.17), 1998 (2.30), 1942 (2.35), 1978 (2.35), 1935 (2.40), 2002 (2.41), 1907 (2.50), 1986 (2.50), 2005 (2.59), 2003 (2.63) , 2001 (2.64).
So that's a whole lot of silliness.
Let me know if you'd like the R code.