Another stereograph animation.
Click for larger version.

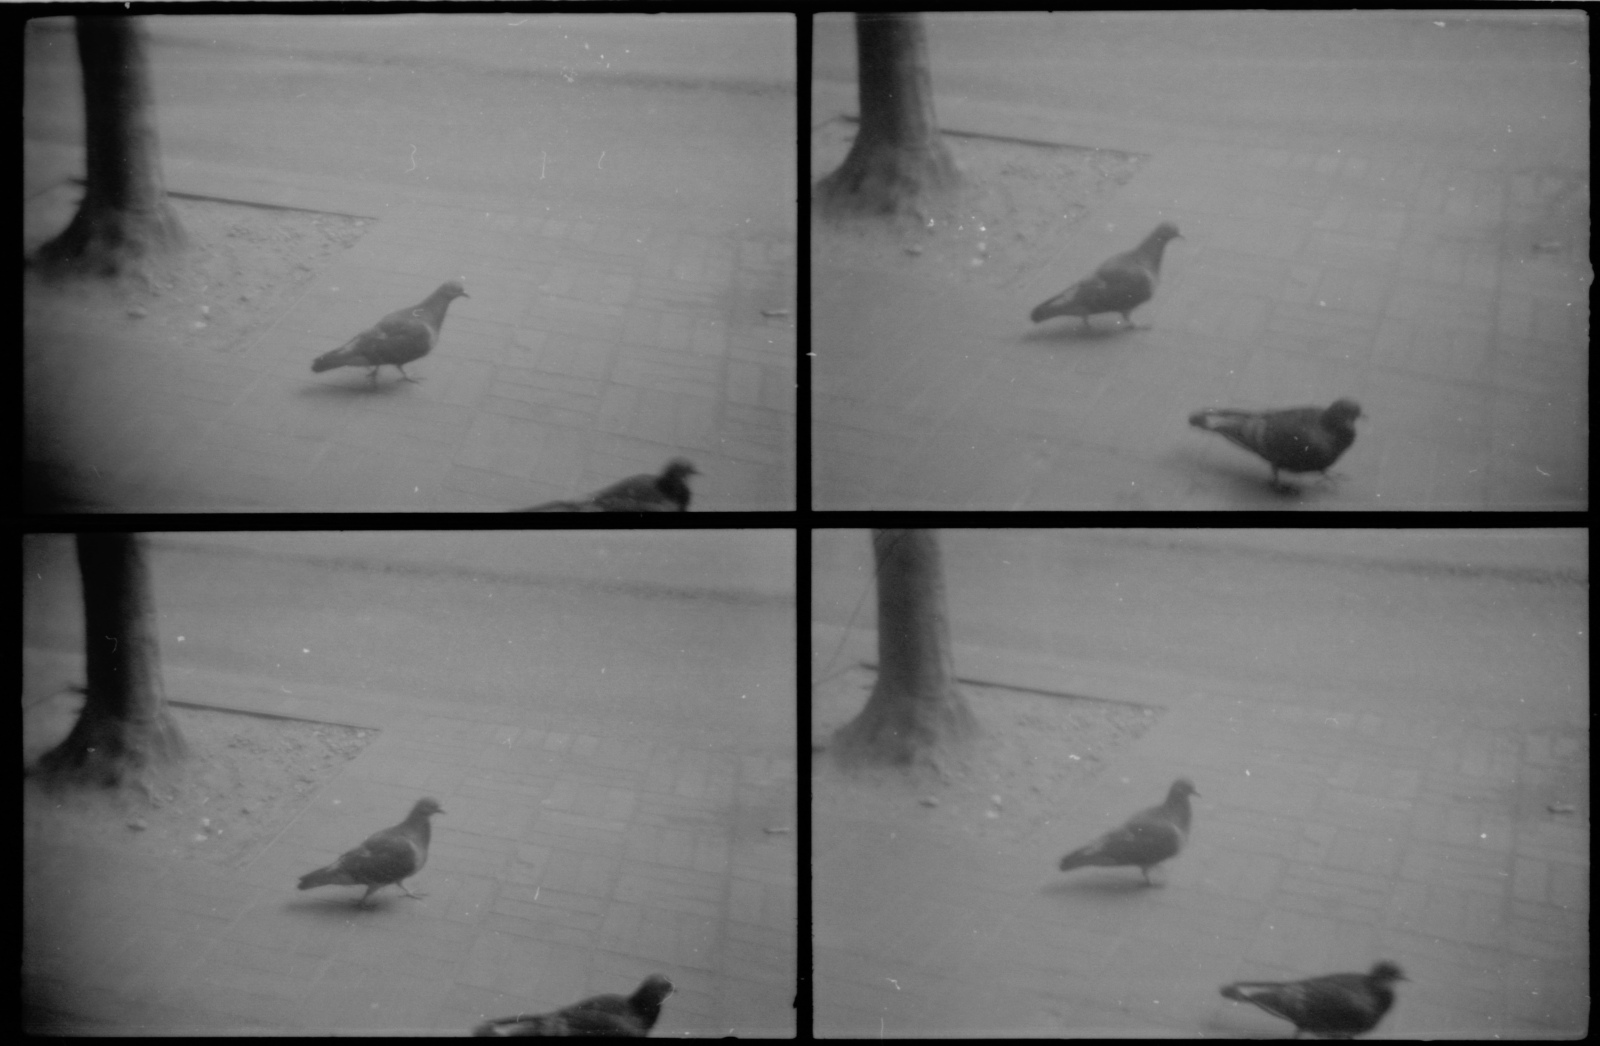
Pigeons, shot with a cheapo "quad cam", 2003.
I keep track of my movie watching on MovieLens, a free service of the University of Minnesota. I've rated about 1000 movies. The site lets you look at your own rating data a few ways, but it also lets you download all* of it. So, I downloaded by data and wrote some R bits to make the following plots.
'*' Not actually all of it. There are two relevant files you can download. One has your ratings and the date when you made that rating, but it only goes back to 2015. Another has all of the movies you've rated, and your rating, but it does not include the date when you rated the movie.
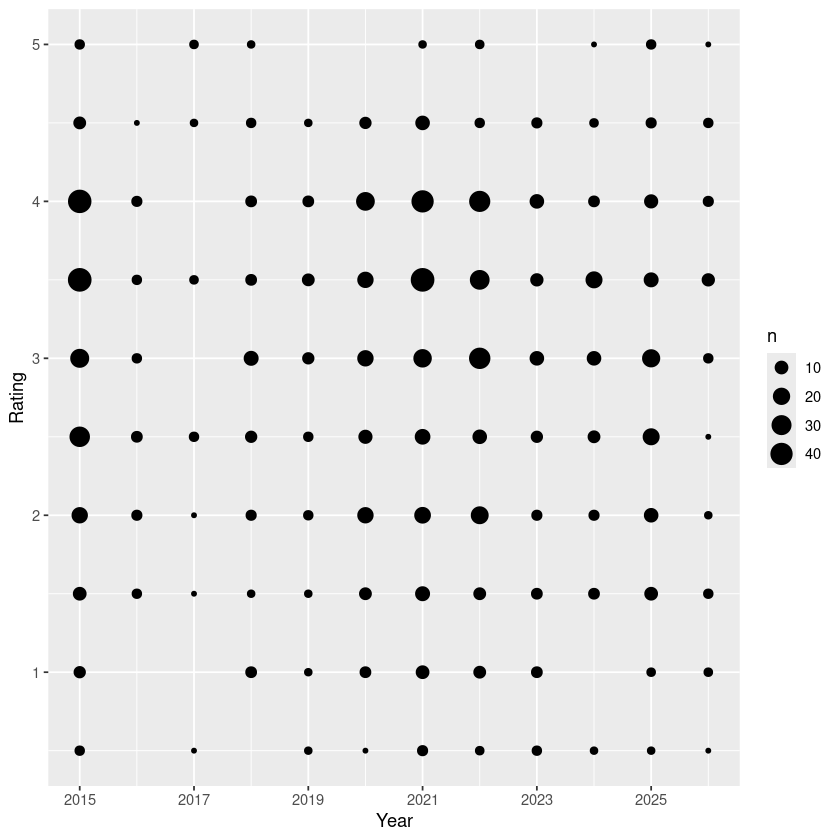
The first plot shows the number of each rating (0.5,1,1.5,...,5) versus the year I rated the movie. 2026 isn't over yet, of course.
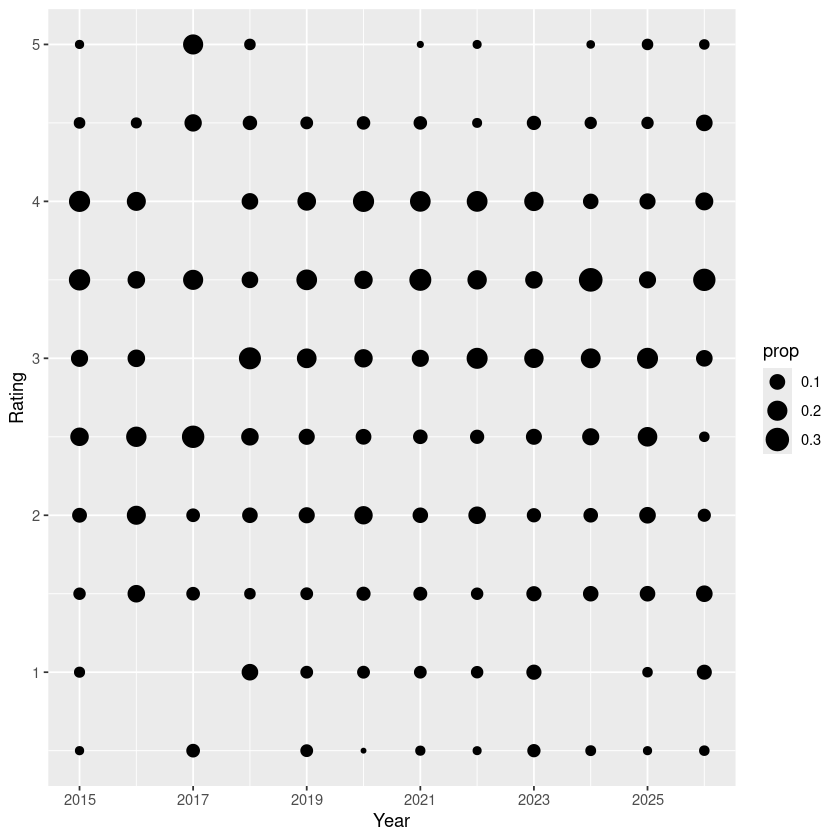
This one shows the same data, but proportionally: the percent of each rating in each year. This is the one I was initially interested in, to see if I'm getting more or less "harsh". Ultimately, not that interesting.
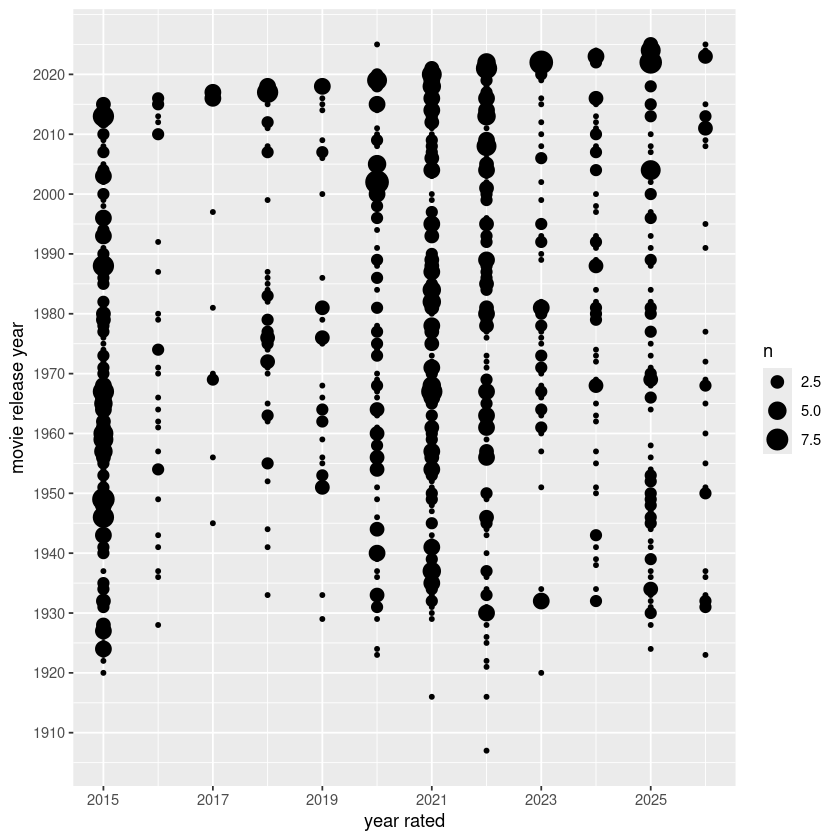
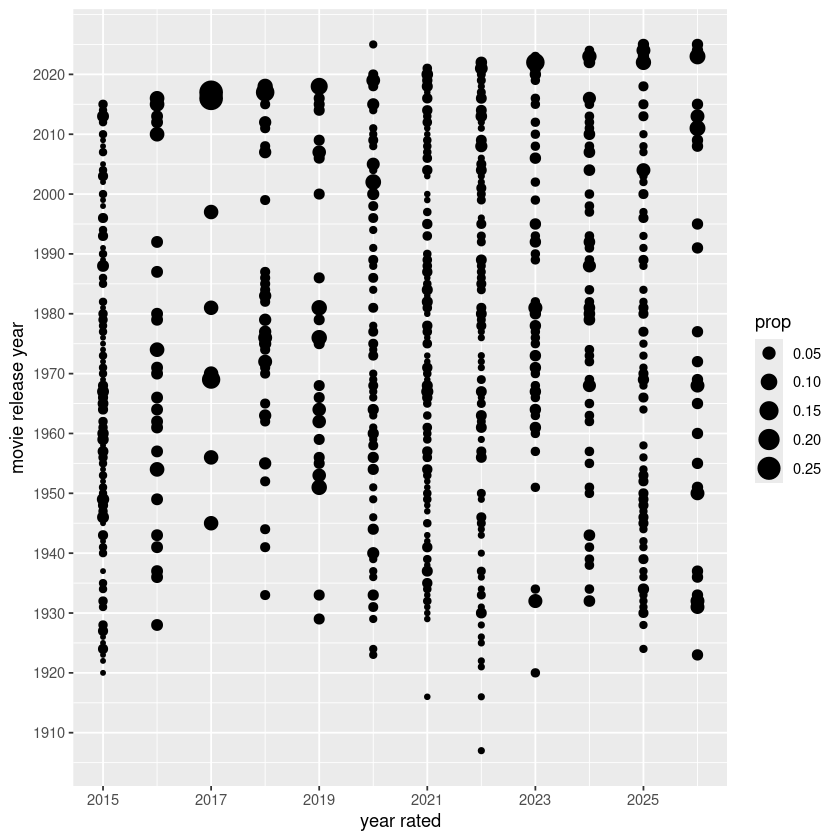
This one shows the year of release versus the year of rating.
This is again the year of release versus the year of rating, normalized by year.
This one shows number of ratings verses release year. (Click to embiggen.)
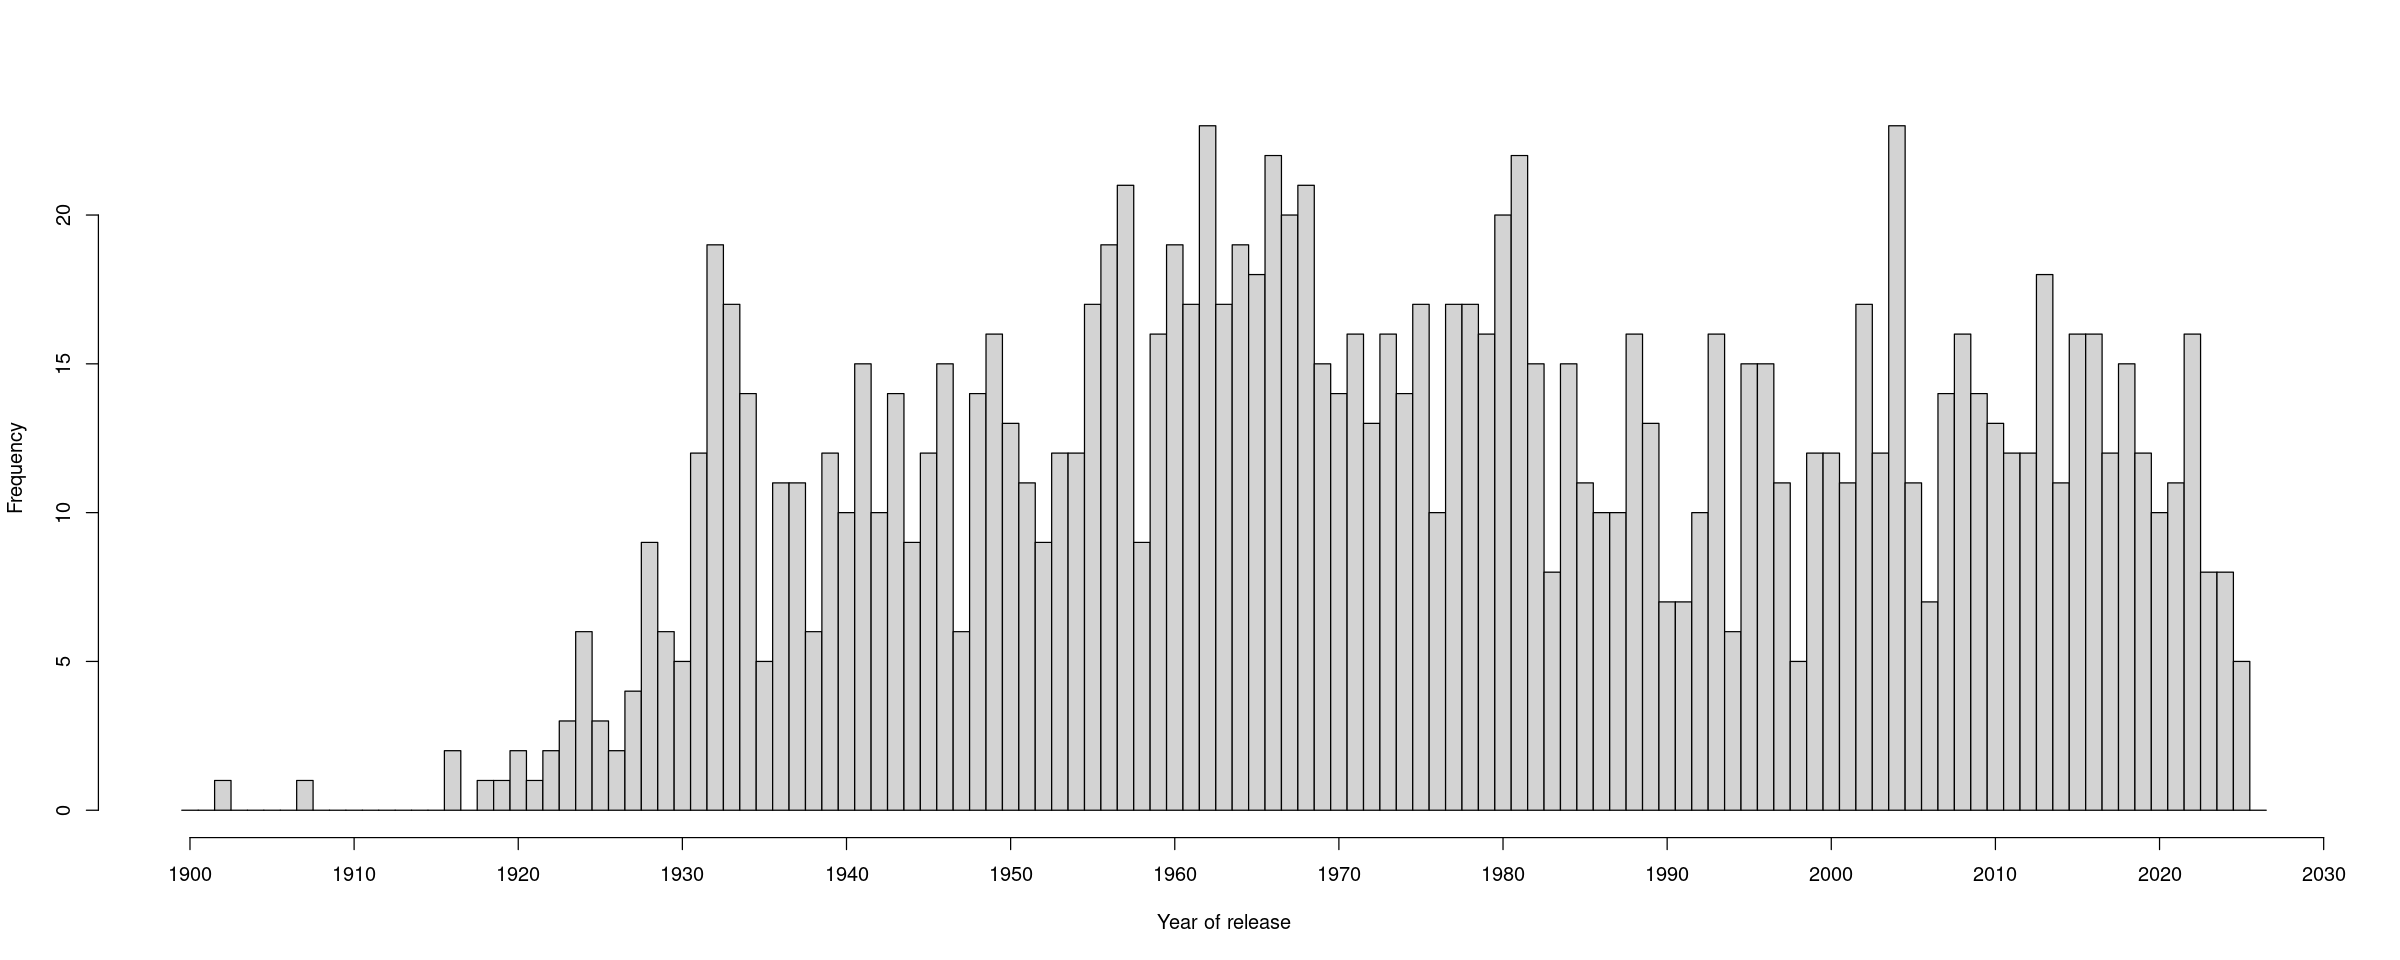
The years with the most ratings are 2004 (23), 1962 (23), 1981 (22), 1966 (22), 1968 (21), 1957 (21), 1980 (20), 1967 (20).
and the years after 1929 with the fewest ratings starts 1930 (5),1935 (5), 1998 (5), 2025 (5), 1938 (6), 1947 (6), 1994 (6), 1990 (7), 1991 (7), 1983 (8).
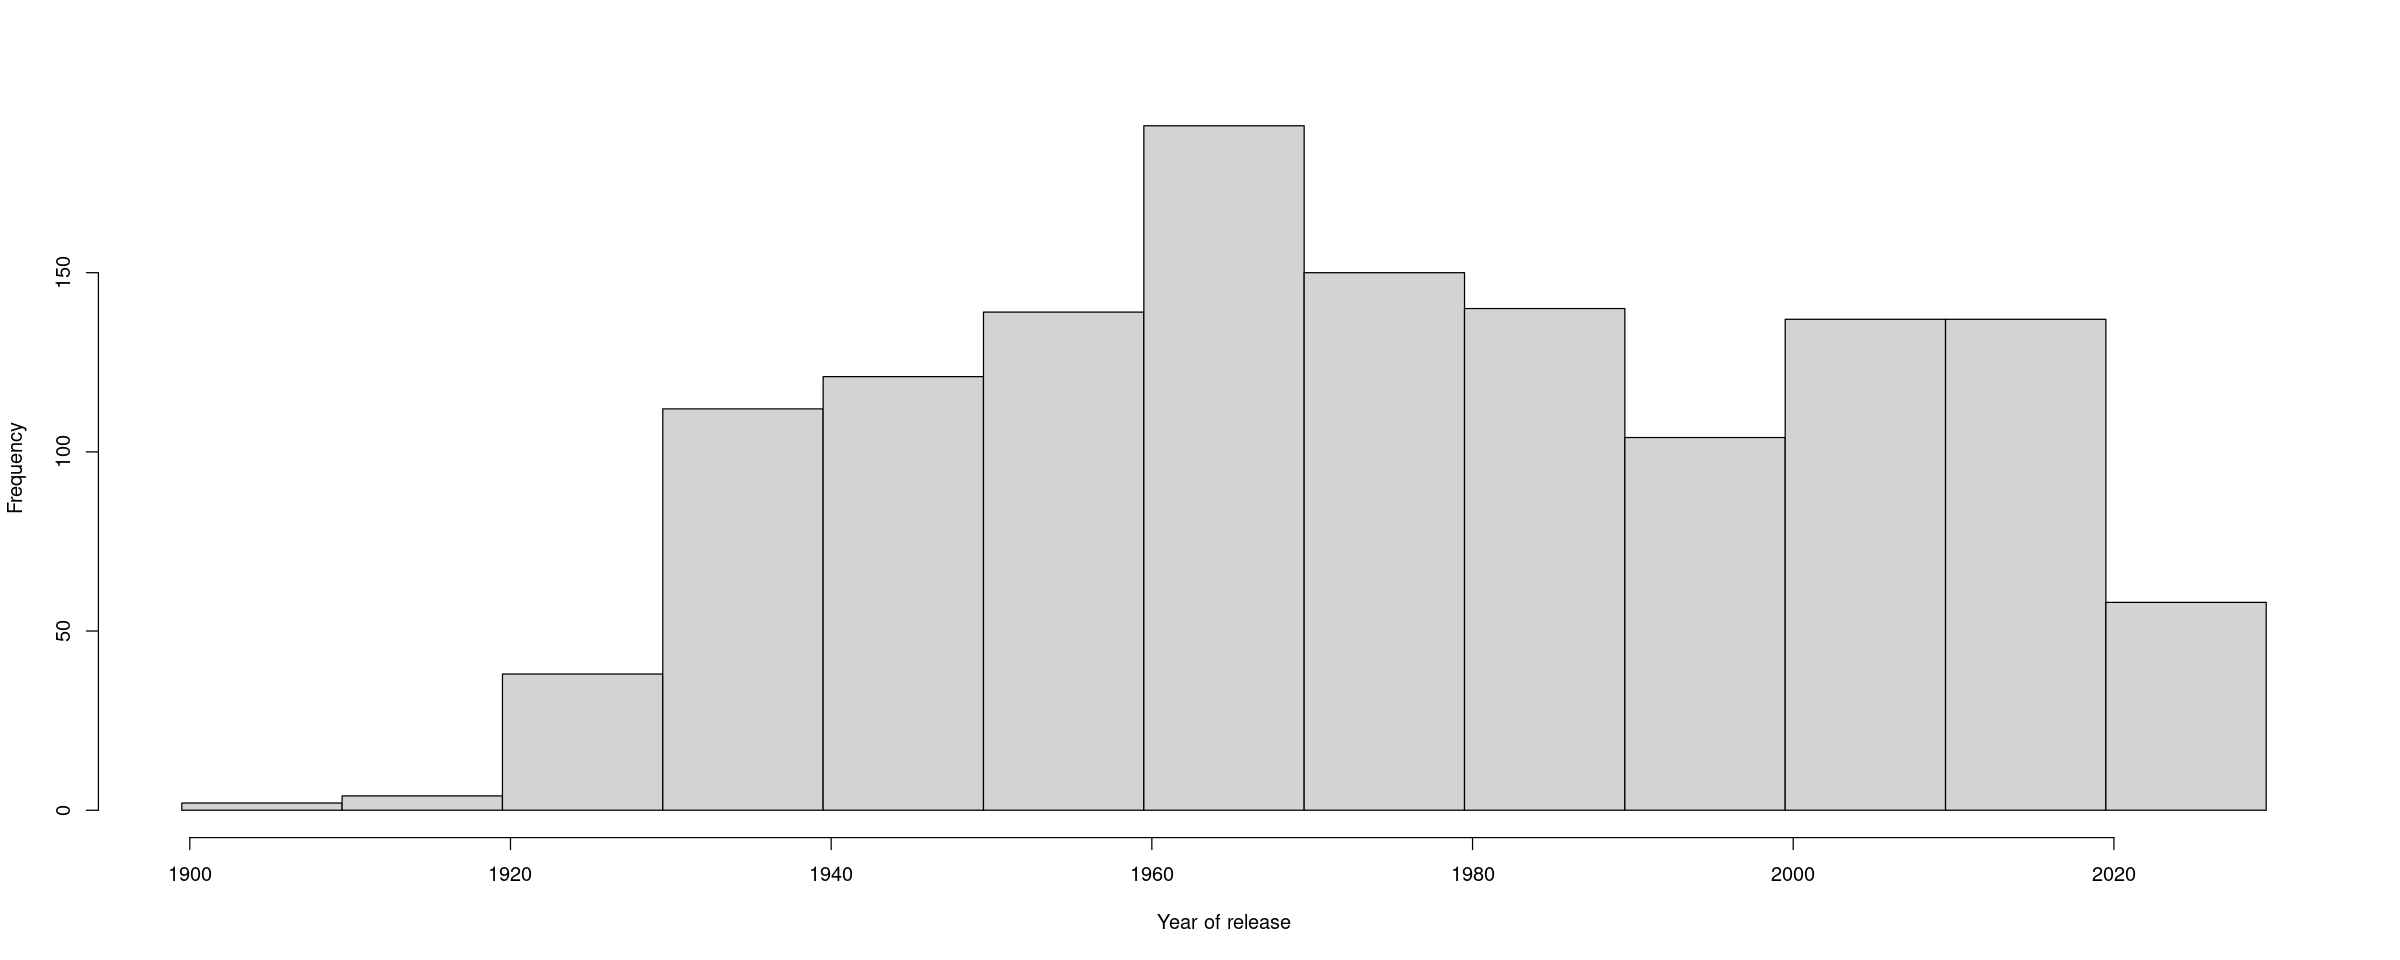
This one shows number of ratings versus release year again, grouped by decades. (Click to embiggen.)
Now, here's the mean rating by year of release:
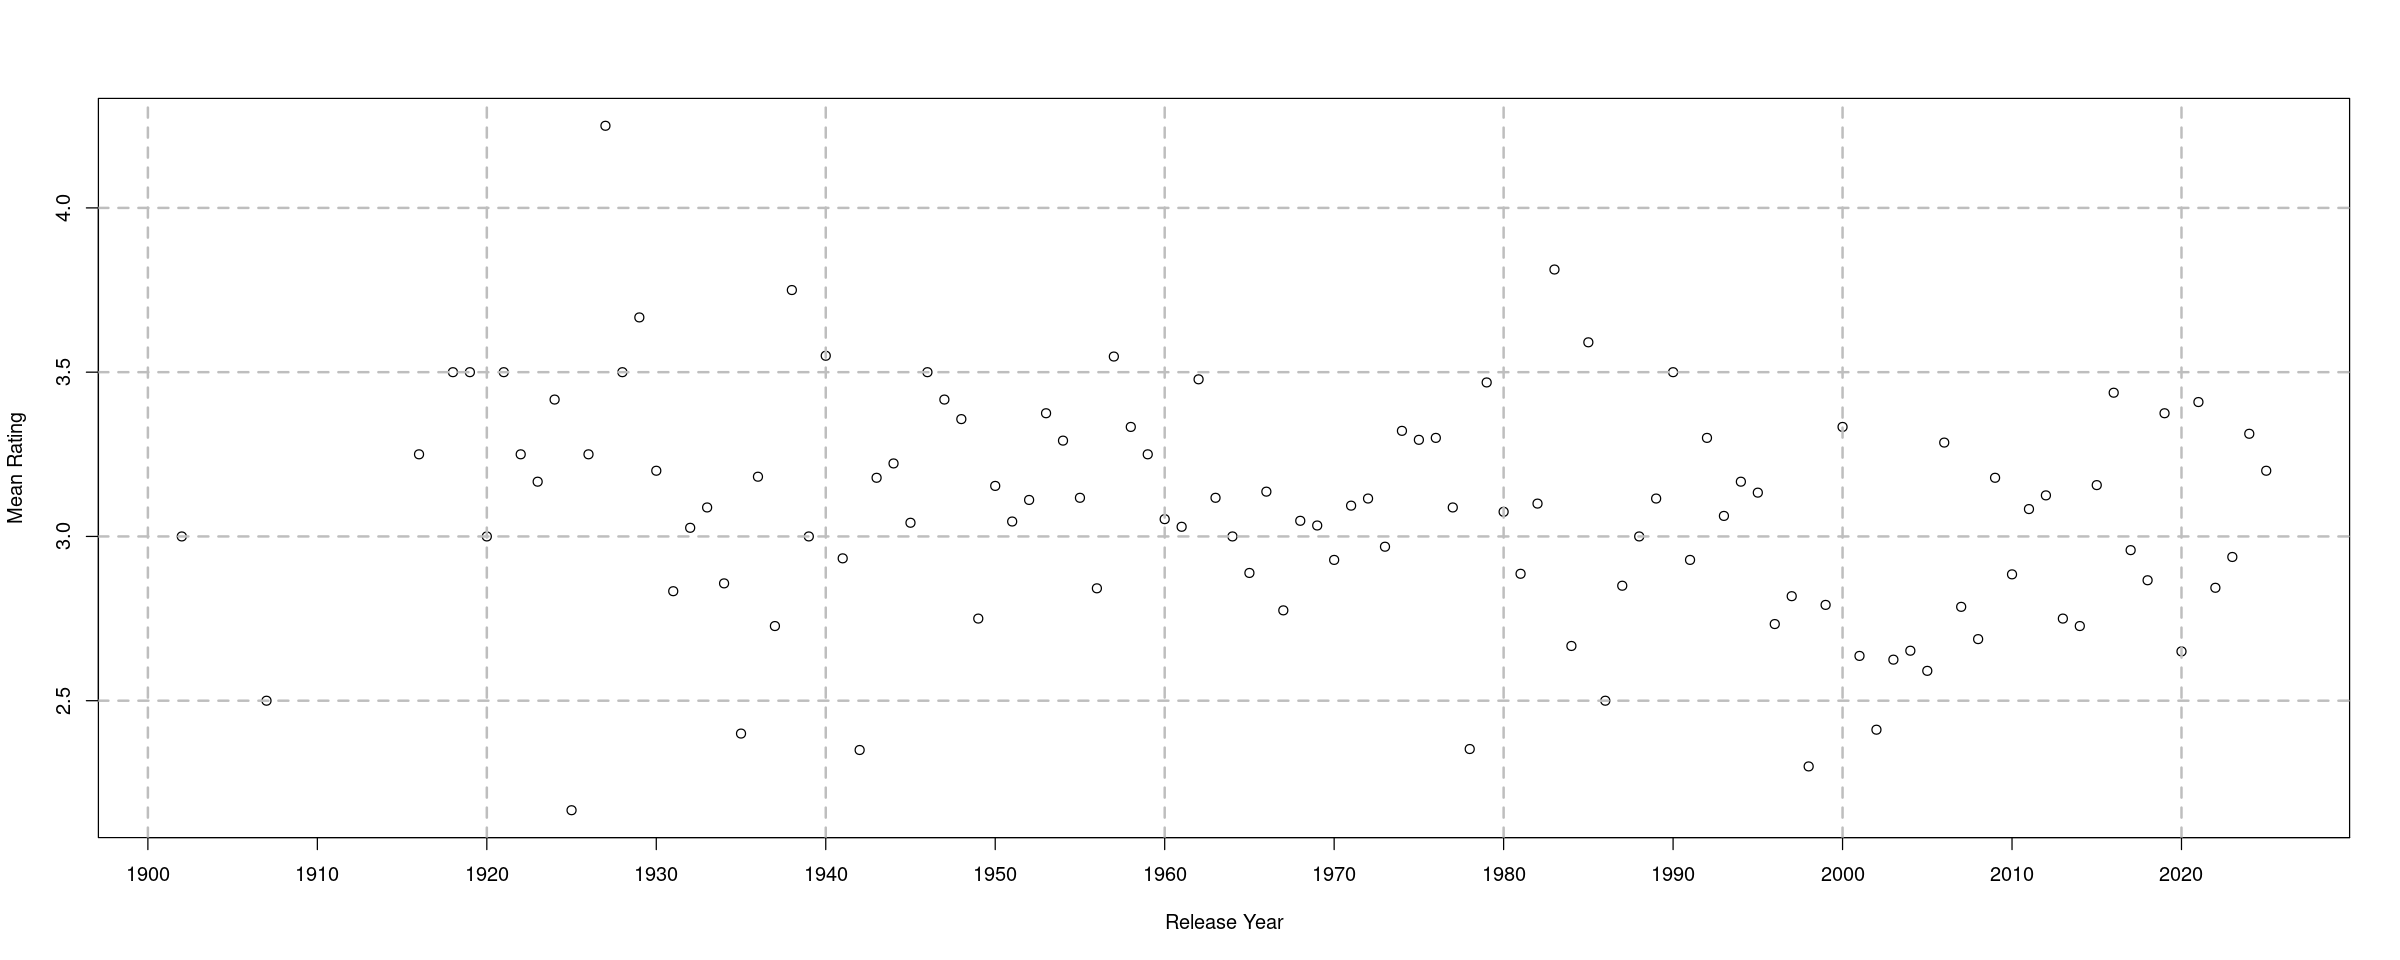
Years with highest mean ratings are 1927 (4.25), 1983 (3.81), 1938 (3.75), 1929 (3.67), 1985 (3.59), 1940 (3.55), 1957(3.55).
Years with the lowest mean ratings are 1925 (2.17), 1998 (2.30), 1942 (2.35), 1978 (2.35), 1935 (2.40), 2002 (2.41), 1907 (2.50), 1986 (2.50), 2005 (2.59), 2003 (2.63) , 2001 (2.64).
So that's a whole lot of silliness.
Let me know if you'd like the R code.
A new video piece! This one has moving particles that create audio chords based on the convex hulls that one can create from the particles.
Revisiting some old code over breakfast.

I finished another chapbook. This one is straight-up mathematics illustration.
If we consider the quadratic Gauss sums
 we can see these are equal to the sums
 where m(k) is the number of solutions of k=j2 modulo n.
So I was interested in these m(k), so I made diagrams like this one (for n=168)
 that show the squares modulo n as dark circles located on the unit circle (i.e., j2 will be located at e2 pi i j2/n with a "stack" of dark circles indicating the square's multiplicity, m, for that modulus.
I thought the figures looks intriguing, so I created a chapbook with all the figures for squares up to n=200 and for cubes up to n=201.


Send me a postal address and I'll mail one to you!
There are many features and patterns one can notice with these figures that lead us to some questions, some harder than others. Here are a few.

This is also true for n=90 and n=99. Can we nicely described n that have this pattern?
Many more questions arise while looking at the figures!
I'm feeling out of sorts tonight, so I fell back on my usual thing: making an animated gif from LOC stereograph images.

When I was in grad school in Boulder in the 1990s, I remember going to Eldorado Springs with a friend. We would fill up water bottles from a hose that gave out the free mineral springs water. I hadn't thought about there being a pool there, but this image reminded me there was one. I never swam in it, though.
Animation from a LOC stereograph
More of my animated stereographs here.
Click to embiggen.

Reworking an algorithm I wrote a long time ago.

I added a new problem (#29 of now 83 problems) to my dice problem collection.
If we roll a die and multiply the results as we go, how many rolls on average will we need until the product is a perfect square?
For a six-sided die the expected number of rolls is 8. Curiously, this is the same as for a five-sided die. The general situation is that the expected number of 2^pi(s) where s is the number of sides of the die and pi(x) is the number of primes less than or equal to x.
Since 6 is not prime, the expected number is the same for 5 and 6-sided dice.
Curiously, it does not matter if the die is fair. As long as, for example, all sides are possible, the expectation is 2^pi(s).
One could ask: for what subsets A of the positive integers does the expected number of rolls until the product is in A depend only on s? This is the case when A is the set of perfects squares. What other A can we consider?